Select date from and date to
On this page we will look at what it takes to create a dashboard panel with a two datepicker.
We are going to format the date extract from the database
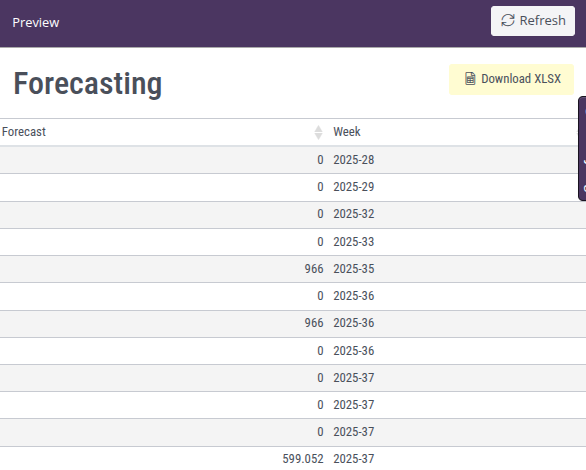
The end result is a dashboard panel that shows a forecast.
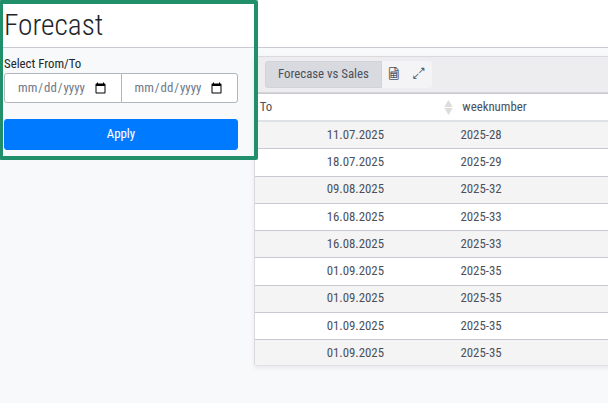
dashboard panel with time range. The time range is marked with green.
Implementing this feature requires configuration of multiple parts of the system:
- Create a data extract with time fields
- Add hooks for the dashboard panel to the time fields in the data extract
- Add a panel on a Custom Dashboard
- Add a date selector to the dashboard panel
- Configure a filter for the dashboard dashboard panel
In this tutorial we will start bottom-up, so in the end we will see the final result.
Prerequisites
There must be a forecast available in the system.
Create Data Extract
- Select Data Extract from the Powerpack menu
- Click on the Create Extract button in the top right corner. This will open a configuration dialog for the Data Extract
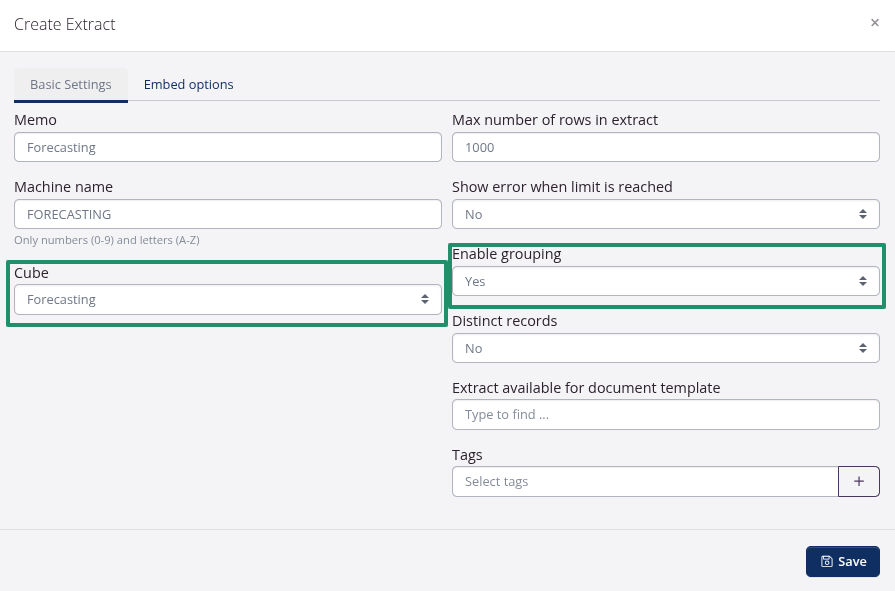
The edit basic information dialog
- Give the extract a name you can recognize when you come to configure the dashboard panel.
- Set Enable grouping to Yes, this is important because you will group units into weeks later in this tutorial.
- Select the Forecast cube and click the Save button. This will close the dialog .
Create the “From” field
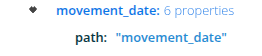
From the Field Explorer on the left side of the window, select movement_date:
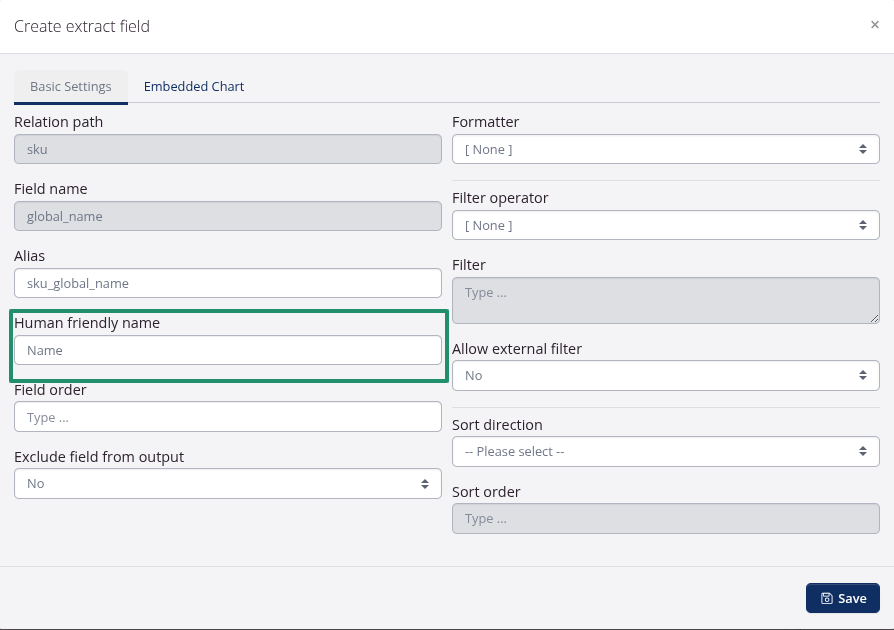
Configure the “From” date field
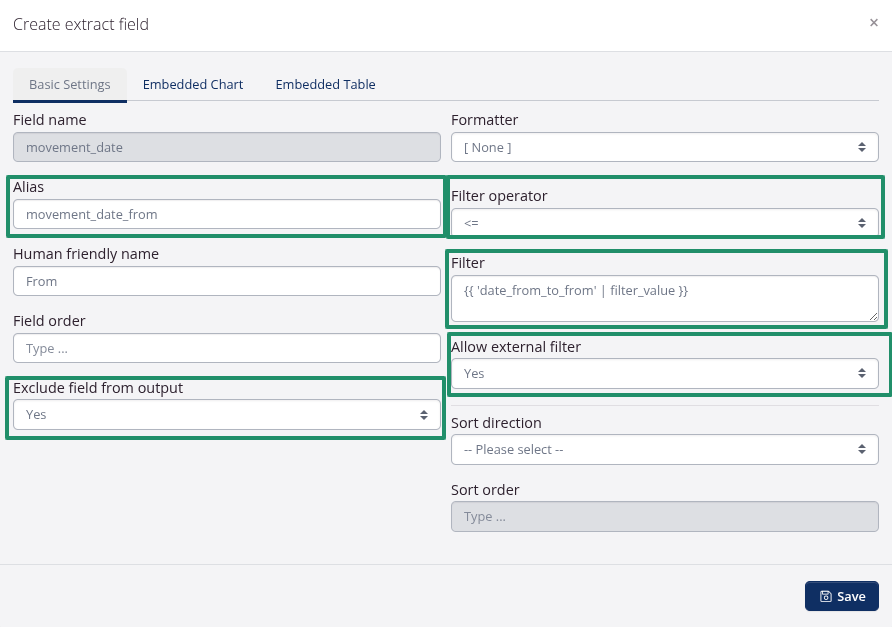
- Fill in the Field name, Alias and Human friendly name.
- Exclude field from output → set to Yes (this prevents the field from being displayed in the data extract)
- Filter operator → set to greater than or equal to (
>=) - Filter → set to the following:
1
{{ 'date_from_to_from' | filter_value }}
⚠️ Important: Note the name date_from_to_from. This is what you are going to use later when you connect the dashboard panel to this data extract.
- Allow external → set to True, This allows the dashboard panel to set the data range in the filter.:w
Create and configure the “To” date field
Create a new field like you just did with the From field
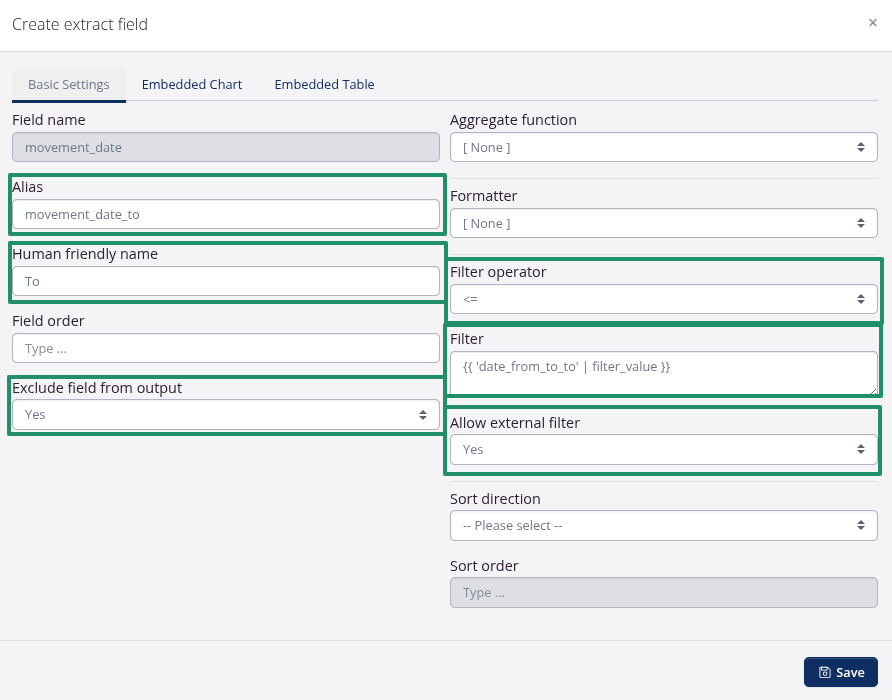
- Exclude field from output → set to Yes (this prevents the field from being displayed in the data extract)
- Filter operator → set to less than or equal to (
<=) - Filter → set to the following:
1
{{ 'date_from_to_to' | filter_value }}
⚠️ Important: Note the name date_from_to_to.
- Allow external → set to True
Notice
Remember the date_from_to_from and date_from_to_to Liquid variable names — we are going to use them later for the date-picker selectors in the Custom dashboard panel, where we will create a panel to display the data extract.
Create the Week number field
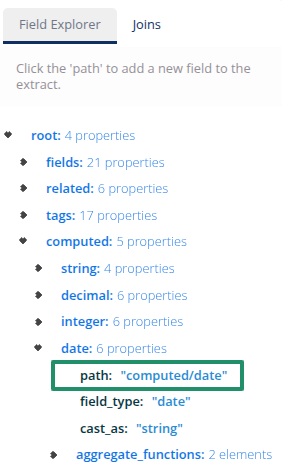
Configure the Week number field
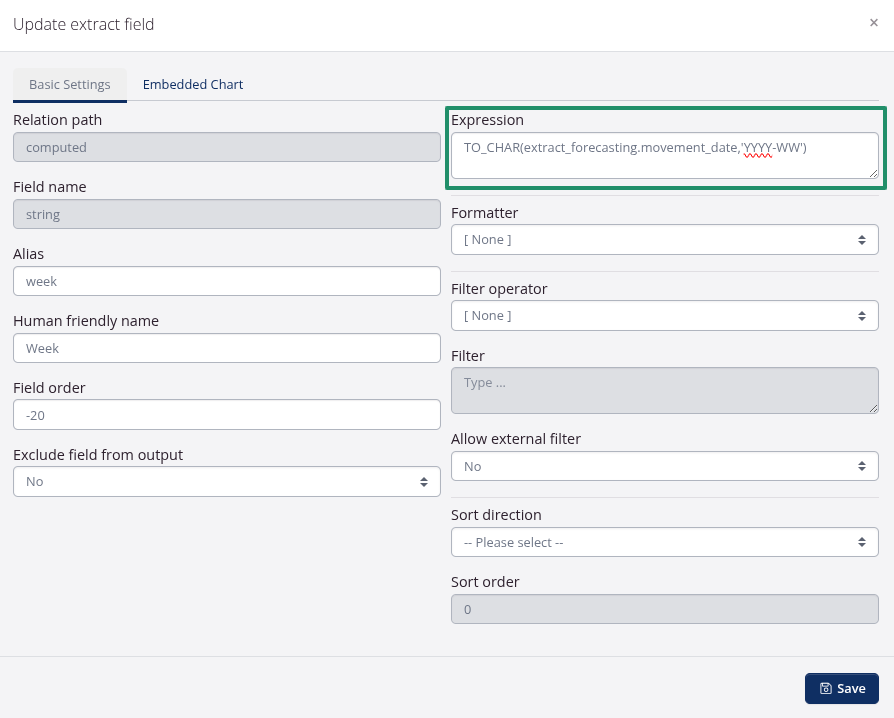
In the Expression field type the following:
1
TO_CHAR(extract_forecasting.movement_date,'YYYY-WW')
-
extract_forecasting.movement_date
Refers to a column namedmovement_datein the table (or view)extract_forecasting.
This column is typically of typeDATEorTIMESTAMP. -
TO_CHAR(.., 'YYYY-WW')
TheTO_CHARfunction converts a date/timestamp (or number) into a formatted text string.
The format string'YYYY-WW'means:YYYY= 4-digit year (e.g.2025)WW= week number of the year (01–53), where week 1 starts on January 1
Result:
This expression produces a year–week label based on the date. Examples:
"2025-01""2025-38"
depending on the value of movement_date.
Create sku name field
From the Field Explore expand the *related/sku ellement
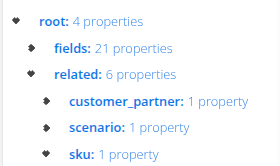
Select sku/global_name
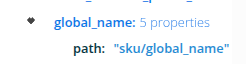
You can set Human friendly name to Name although it is not required
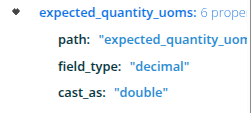
Create a field that sums the expected units of measurements (uom)
From the Field Explore expand the fields/actual_quantity_uof ellement and click on path to add the field
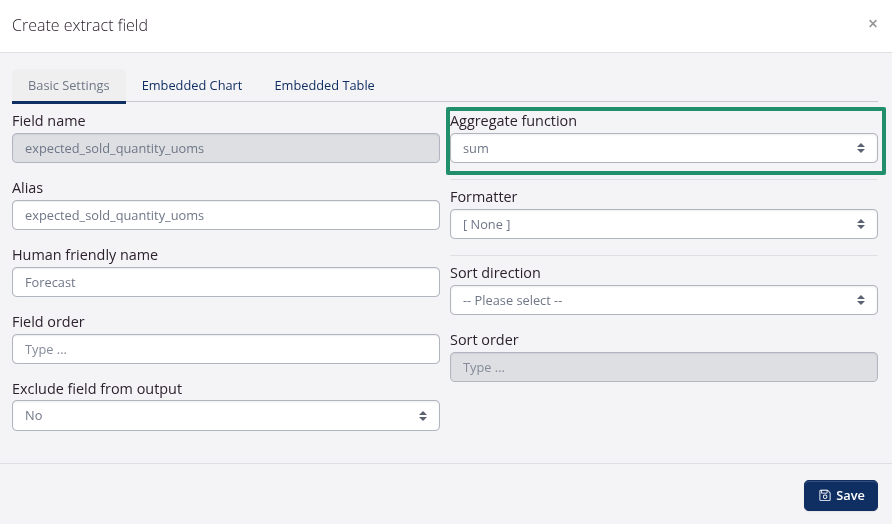
Select Sum from the Aggregate function menu.
Validate table
The table to the right should look something like this
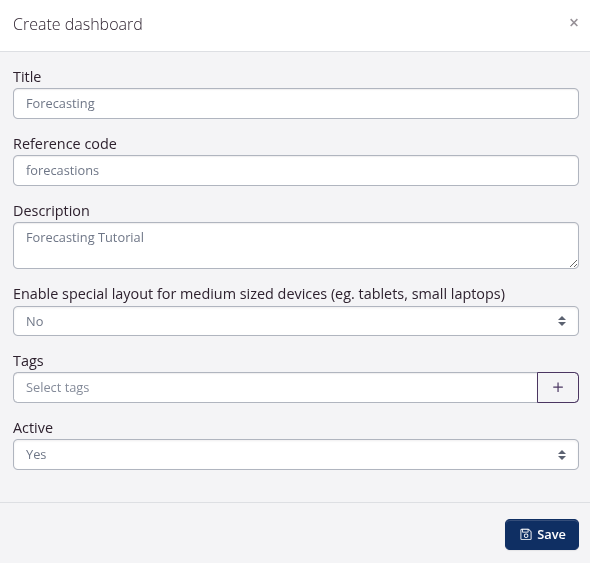
Create a custom dashboard
- From the Powerpack menu select Custom Dashboards
- In the top right corner click on the Create dashboard button
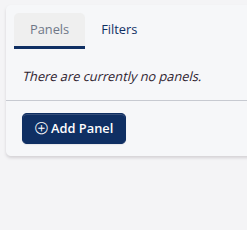
Add a panel
- From the left side click the Add panel button
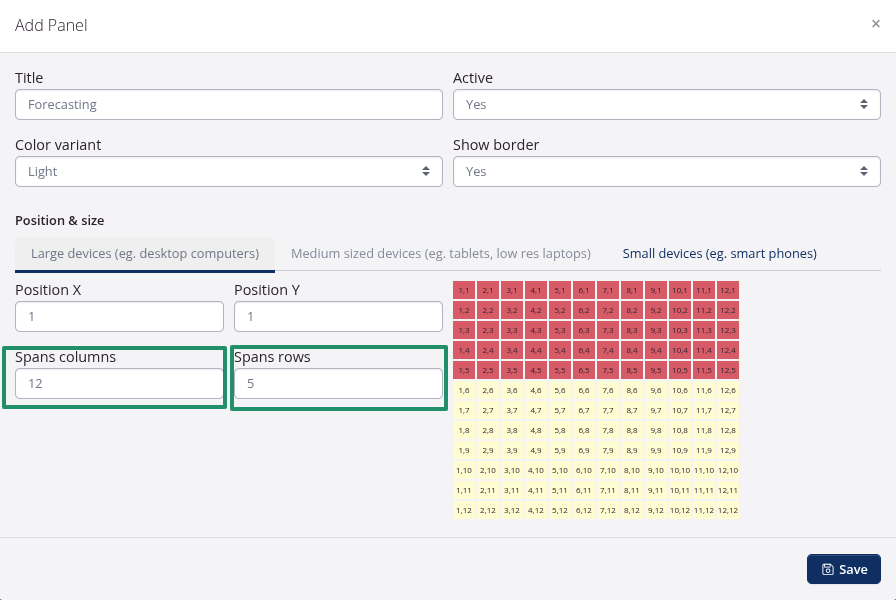
- Set The position and sizing and press save.
Edit the panel
- Click on the small Edit button
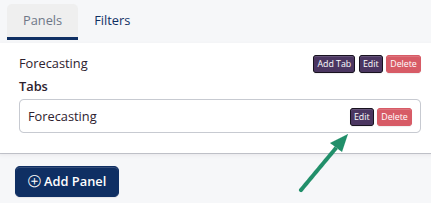
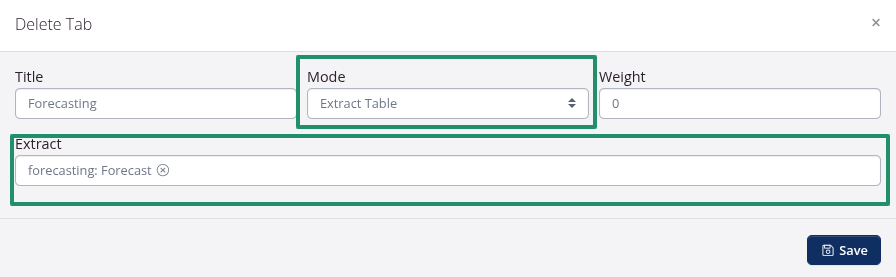
- Select Table from the Mode dropdown
- Find the Data Extract we just created and select it
- Click Save to close the window
Add the date picker
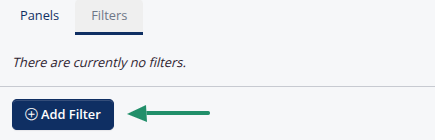
- From the right side make sure filter tab is selectet in the left panel.
- Click on the Add Filter button.
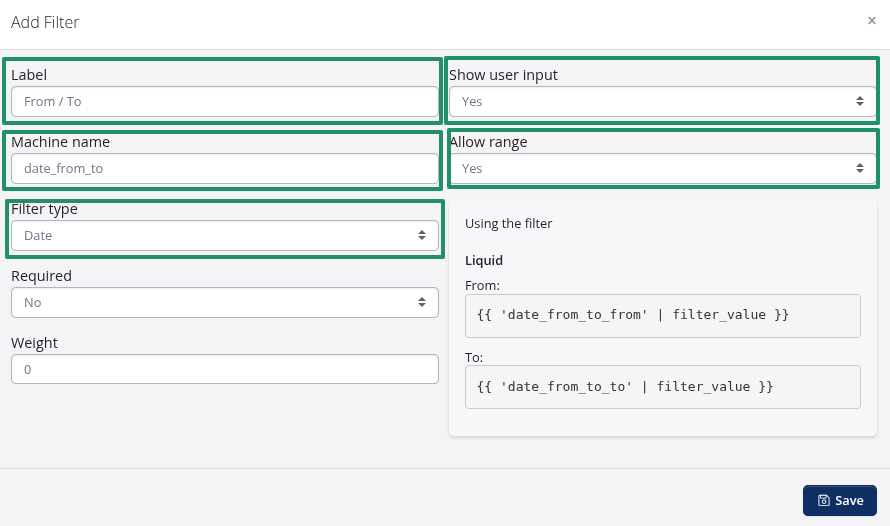
- Give the datepicker a label
- Set the Machine name to date_from_to
- Set the Filter type to Date
- Set Show user indput to Yes
- Set Alow range to Yes
Note: The Liquid From: and the To:.
{{ 'date_from_to_from' | filter_value }} {{ 'date_from_to_to' | filter_value }}The date_from_to_from and date_from_to_to are created based Machine name
This value has to match the values we previously set in the Configure the From Date Field. and
This value has to match the values we previously set in the Configure the To Date Field. .